Tag: Data Planet Visualizations
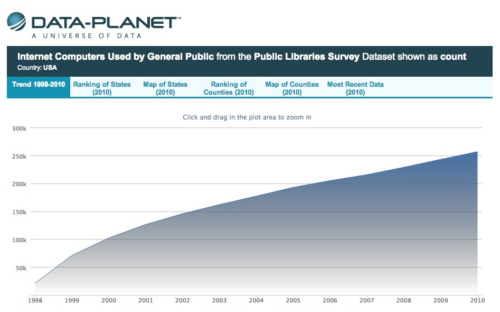
Visualizing Library Statistics: Number of Internet Computers Used by General Public in U.S. Public Libraries (1998-2010)
Here’s the second interactive data visualization in our new library data visualization series that we began last week using the database and interactive visualization technology from Data-Planet. What You’re Viewing You’re looking at a static image of an interactive graphic (with more data) that you can access by either clicking the image or by clicking […]
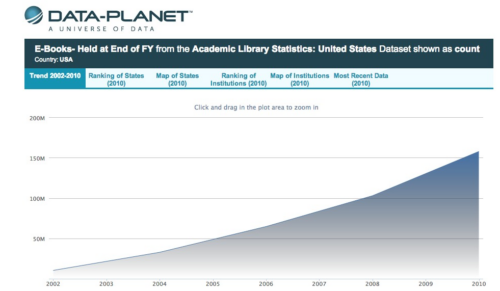
Visualizing Library Statistics: Academic Library Ebook Holdings, 2002-2010
Click the graphic or this link to view an interactive version and additional data. This post marks the beginning of a new feature on LJ‘s infoDOCKET where we will share interactive visualizations of library and library related statistics using data sets from several sources. We would like to thank Matt Dunie and the team at […]
