The U.S. Census Bureau, in partnership with the National Telecommunications and Information Administration (NTIA), today announced the launch of the ACCESS BROADBAND Dashboard.
ACCESS BROADBAND stands for Advancing Critical Connectivity Expands Service, Small Business Resources, Opportunities, Access, and Data Based on Assessed Need and Demand Act. The new data tool shows how changes in broadband infrastructure expansion may impact local economies.
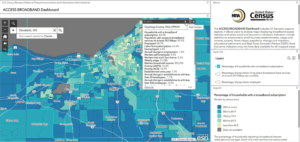
Source: U.S. Census
The dashboard includes a series of maps showing different broadband access measures, as well as economic characteristics that research suggests could be influenced by increased access to broadband. Maps display statistics on employment, small business establishments, wages and income, poverty, home values, population change and migration, educational attainment, and gross domestic product (GDP).
Maps include statistics for U.S. states (including the District of Columbia) and counties, with a few select key indicators available at the census tract level. Most maps also include statistics for Puerto Rico.
The Census Bureau and NTIA plan to update the dashboard annually so users can assess the economic context of areas where broadband availability and adoption efforts are underway. Each release will include the interactive dashboard and supplemental data files so users can access the underlying map data.
The 21 maps included in the ACCESS BROADBAND Dashboard show the:
Percentage of households with a broadband subscription.
Percentage of population living where broadband fixed services of at least 25/3 Mbps are available.
Percentage of population employed.
Labor force participation rate.
Unemployment rate.
Annual change in employment.
Percentage of workers self-employed.
Percentage of workers that work from home.
Average weekly wage (dollars).
Median household income (dollars).
Poverty rate (Census Bureau’s Small Area Income and Poverty Estimatesor SAIPE).
Poverty rate (American Community Survey or ACS).
Establishment entry rate.
Annual change in business establishments with less than 20 employees.
Annual change in business establishments with less than 500 employees.
Annual change in real Gross Domestic Product (GDP).
Median home value (dollars).
Annual change in population.
Net migration rate.
Percentage of population with a bachelor’s degree or higher.
Percentage of high school-aged population that did not graduate and are not enrolled in school.
Gary Price (gprice@gmail.com) is a librarian, writer, consultant, and frequent conference speaker based in the Washington D.C. metro area.
He earned his MLIS degree from Wayne State University in Detroit.
Price has won several awards including the SLA Innovations in Technology Award and Alumnus of the Year from the Wayne St. University Library and Information Science Program. From 2006-2009 he was Director of Online Information Services at Ask.com.