New Online: NASA, Partners Release “Sea Level Change Projection” Visualization Tool
From NASA:
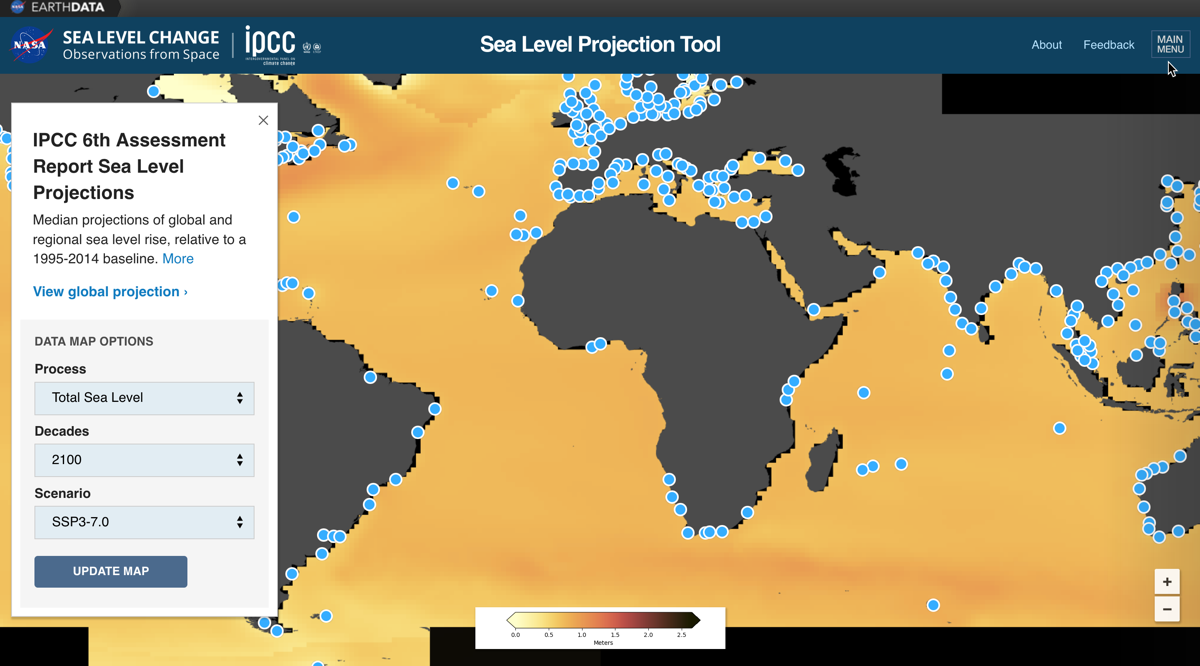
NASA’s Sea Level Change Team has created a sea level projection tool that makes extensive data on future sea level rise from the Intergovernmental Panel on Climate Change (IPCC) easily accessible to the public – and to everyone with a stake in planning for the changes to come.
Pull up the tool’s layers of maps, click anywhere on the global ocean and coastlines, and pick any decade between 2020 and 2150: The tool, hosted on NASA’s Sea Level Portal, will deliver a detailed report for the location based on the projections in the IPCC’s Sixth Assessment Report, released on Aug. 9, which addresses the most updated physical understanding of the climate system and climate change.
The IPCC has provided global-scale assessments of Earth’s climate every five to seven years since 1988, focusing on changes in temperature, ice cover, greenhouse gas emissions, and sea level across the planet. Their sea level projections are informed by data gathered by satellites and instruments on the ground, as well as analyses and computer simulations.
[Clip]
But for the first time, anyone will be able to see a visualization of how sea levels will change on a local level using the new online tool, a granularity that is difficult to capture in the IPCC report itself.
[Clip]
The tool can display possible future sea levels under several greenhouse-gas-emission and socioeconomic scenarios, including a low-emissions future, a “business as usual” trajectory with emissions on their current track, and an “accelerated emissions” scenario. A low-emission future, for example, would occur if humanity reduces its greenhouse gas emissions, lessening the effects of climate-driven sea level change. The other end of the emission spectrum yields projections with the most rapid rise in sea level, information that could be useful for coastal planning that takes less likely but potentially more destructive possibilities into account.
Direct to Sea Level Projection Tool
Learn More, Read the Complete Announcement
On a Related Note… Also Just Released: IPCC WGI Interactive Atlas
A novel tool for flexible spatial and temporal analyses of much of the observed and projected climate change information underpinning the Working Group I contribution to the Sixth Assessment Report, including regional synthesis for Climatic Impact-Drivers (CIDs).
Filed under: Data Files, Maps, News, Reports
About Gary Price
Gary Price (gprice@gmail.com) is a librarian, writer, consultant, and frequent conference speaker based in the Washington D.C. metro area. He earned his MLIS degree from Wayne State University in Detroit. Price has won several awards including the SLA Innovations in Technology Award and Alumnus of the Year from the Wayne St. University Library and Information Science Program. From 2006-2009 he was Director of Online Information Services at Ask.com.
ADVERTISEMENT
Archives

ADVERTISEMENT