New Data: American Community Survey Provides New State and Local Income, Poverty and Health Insurance Statistics
From the U.S. Census:
The U.S. Census Bureau today released its most detailed look at America’s people, places and economy. New state and local statistics on income, poverty and health insurance are available in briefs, detailed tables, data profiles and more. The American Community Survey (ACS) also produces statistics for more than 40 other topics.
“Each completed survey is important because it is a building block used to create statistics about communities in America,” said Census Bureau American Community Survey Office Chief Donna Daily. “This information provides an important tool for communities to make data-driven decisions, assess the past, and plan for the future.”
These local-level income, poverty and health insurance statistics from the ACS complement the national-level statistics released on Tuesday, Sept. 10, 2019. National-level statistics are from the Census Bureau’s Current Population Survey Annual Social and Economic Supplement (CPS ASEC). The CPS ASEC is the leading source for national-level data on income, poverty and health insurance, while the ACS is the leading source for community and local-level data.
At the state level, 14 states saw an increase in income, and14 states saw a decrease in poverty rates between 2017 and 2018. During 2018, the percentage of people without health insurance at the time of interview ranged from 2.8% in Massachusetts to 17.7% in Texas. Between 2017 and 2018, the uninsured rate decreased in two and increased in five of the 25 most populous metropolitan areas.
The findings are from the Census Bureau’s 2018 ACS, the premier source for detailed population and housing information about our nation. These estimates will be released via the Census Bureau’s new data dissemination platform data.census.gov.
Local-level income, poverty and health insurance statistics from the ACS are highlighted below.
Income
- Real median household income in the United States increased 0.8% between 2017 and 2018. The 2018 U.S. median household income was $61,937.
- The 2018 median household income was the highest measured by the ACS.
- Median household income in 29 states and Puerto Rico was lower than the U.S. median. It was higher than the U.S. median in 18 states and the District of Columbia. Wyoming, North Dakota and Vermont had medians not statistically different from the U.S. median. Visit the interactive graphic to see median household income for all states.
- Median household income increased in 10 of the 25 most populous metropolitan areas between 2017 and 2018. None of those 25 metropolitan areas experienced a statistically significant decrease.
Income Inequality
- The Gini index is a standard economic measure of income inequality. A score of 0.0 is perfect equality in income distribution. A score of 1.0 indicates total inequality, where one household has all of the income.
- The Gini index for the United States in the 2018 ACS (0.485) was significantly higher than the 2017 ACS estimate. Five states (California, Connecticut, Florida, Louisiana and New York), the District of Columbia and Puerto Rico had Gini indices higher than the United States, and 36 states were lower.
- Most states experienced no statistical change in income inequality. Income inequality increased in nine states: Alabama, Arkansas, California, Kansas, Nebraska, New Hampshire, New Mexico, Texas and Virginia.
Poverty
- From 2017 to 2018, the poverty rate declined in 14 states and Puerto Rico. In 2018, the poverty rate increased in only one state: Connecticut.
- California, Florida, Georgia and North Carolina had declining poverty rates for the fifth year in a row. In three states (Arizona, Illinois and New York), poverty declined for a fourth consecutive year.
- Seven states had poverty rates less than 10.0%. Visit the interactive graphic to see the 2018 poverty rates for all 50 states and the District of Columbia.
- In seven of the 25 most populous metropolitan areas, the poverty rate declined between 2017 and 2018. The poverty rate declined for the fourth consecutive year in five of those seven metropolitan areas. None of the most populous metropolitan statistical areas experienced a poverty rate increase in 2018.
- For the fourth year in a row, the percentage of people in poverty decreased in the three most populous metropolitan areas: New York-Newark-Jersey City, NY-NJ-PA Metro Area; Los Angeles-Long Beach-Anaheim, CA Metro Area; and Chicago-Naperville-Elgin, IL-IN-WI Metro Area.
Health Insurance
- Six states and the District of Columbia had an uninsured rate less than or equal to 5.0%; six states had an uninsured rate of 12.0% or more. The remainder of states had uninsured rates between 5.0 and 11.9% in 2018. Visit the interactive graphic to see where the all the states fall.
- Between 2017 and 2018, the percentage of people without health insurance coverage at the time of interview decreased in three states. The magnitude of decreases were 1.8 percentage points in Wyoming, 0.5 percentage points in South Carolina, and 0.3 percentage points in New York.
- Boston had the lowest uninsured rate (2.9%) among the 25 most populous metropolitan areas, while Houston had the highest uninsured rate (18.6%) in 2018.
National and state-level health insurance data from the CPS and ACS were released on Sept. 10, 2019.
To access the full set of statistics released today, please visit data.census.gov.
Additional Resources
Data Visualization Tools
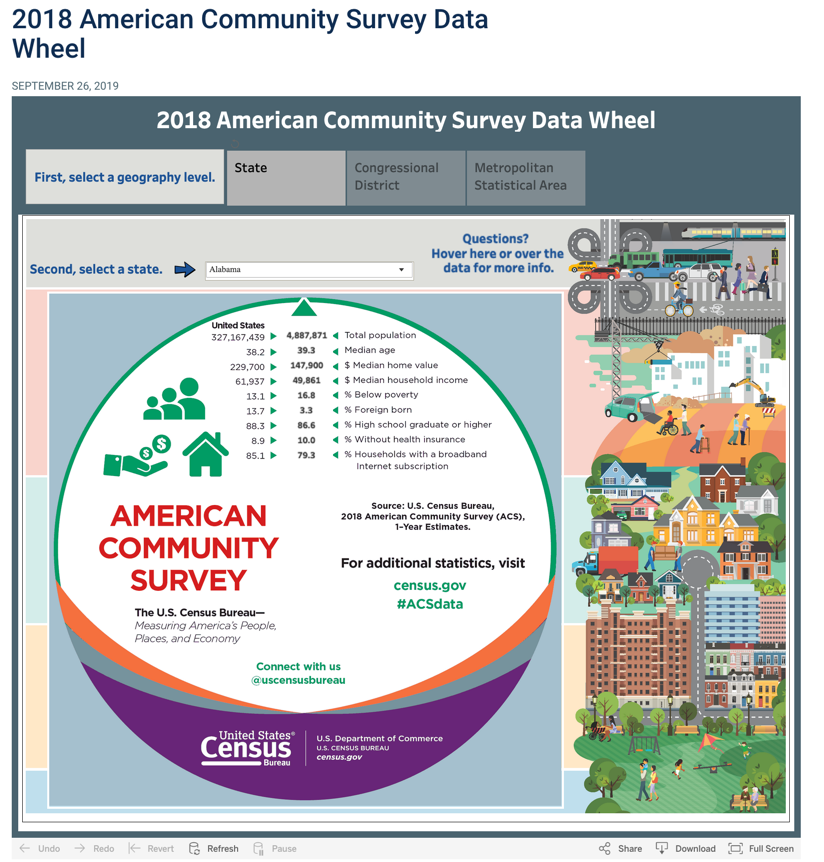
The Census Bureau’s ACS Digital Data Wheel allows users to explore and compare social, economic, housing, and demographic and economic characteristics from all states, U.S. congressional districts and metropolitan statistical areas.
Other visualizations include income, poverty and health insurance data for states through interactive U.S. maps.
Industry and Occupation
Project management specialists, school psychologists and tutors are among the newly added occupations identified in the ACS. Those occupations and others were added in response to the implementation of the 2018 Standard Occupational Classification (SOC). The resulting updates to the 2018 Census Occupation Code list shows which occupations are identified in the ACS.
Up to 570 occupations can be found in tables available on data.census.gov.
In addition to occupation updates, the Census Industry Code list was updated to reflect changes in the 2017 North American Industry Classification System (NAICS) and will be available for the first time on the 2018 ACS.
Filed under: Data Files, Interviews, Management and Leadership, Maps, News, Patrons and Users, Profiles
About Gary Price
Gary Price (gprice@gmail.com) is a librarian, writer, consultant, and frequent conference speaker based in the Washington D.C. metro area. He earned his MLIS degree from Wayne State University in Detroit. Price has won several awards including the SLA Innovations in Technology Award and Alumnus of the Year from the Wayne St. University Library and Information Science Program. From 2006-2009 he was Director of Online Information Services at Ask.com.
ADVERTISEMENT
Archives

ADVERTISEMENT