Nicole Sultanum says one of the fastest ways to understand information is by sight.
“We’re much faster at recognizing patterns,” says Sultanum, a University of Toronto PhD student in the department of computer science and its Dynamic Graphics Project lab.
“If it’s a table of numbers versus a chart, a chart is much faster for you to find how the data is distributed. When text is used, things get a little bit more complicated because somehow you have to translate text into something the computer can understand, which is one of the biggest challenges with text visualization.”
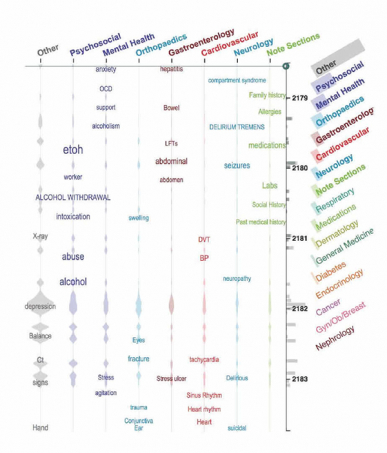
Sultanum, whose research examines text visualization for clinical use, recently presented “Doccurate: A Curation-Based Approach for Clinical Text Visualization” at the IEEE VIS conference in Berlin. An overview of a complex patient with preset filters in Doccurate. Highlights on “alcohol”, “intoxication”, “alcohol withdrawal” and “delirium tremens” provide consistent hints of a significant and adverse history of alcohol abuse, with multiple episodes of withdrawal and related symptoms. Source: University of Toronto
Her co-authors include Dr. Devin Singh, an emergency room physician at Hospital for Sick Children (SickKids), and her graduate co-supervisors in computer science, Professor Michael Brudno and Assistant Professor Fanny Chevalier.
Brudno is an expert in computational medicine and Chevalier specializes in data visualization.
Gary Price (gprice@gmail.com) is a librarian, writer, consultant, and frequent conference speaker based in the Washington D.C. metro area.
He earned his MLIS degree from Wayne State University in Detroit.
Price has won several awards including the SLA Innovations in Technology Award and Alumnus of the Year from the Wayne St. University Library and Information Science Program. From 2006-2009 he was Director of Online Information Services at Ask.com.