Statistics: U.S. Census Releases 2012-2016 America Community Survey Five-Year Estimates Data on More Than 40 Social, Economic, Housing and Demographic Topics
The nation experienced an increase in commuting time, median gross rent and a rise in English proficiency among those who spoke another language. These are only a few of the statistics released today from the U.S. Census Bureau’s 2012-2016 American Community Survey five-year estimates data release, which features more than 40 social, economic, housing and demographic topics, including homeowner rates and costs, health insurance and educational attainment.
The survey produces statistics for all of the nation’s 3,142 counties. In addition, it is the only full dataset available for three-fourths of all counties with populations too small to produce a complete set of single-year statistics (2,322 counties). Each year, Census Bureau data helps determine how more than $675 billion of federal funding are spent on infrastructure and services, from highways to schools to hospitals.Data Highlights
The following highlights are from the 2012-2016 American Community Survey five-year estimates release, unless otherwise noted.Commuting Characteristics
- The longest average one-way travel times are generally associated with larger metro areas or smaller metro areas within commuting distance of a larger metro area. Among the longest were:
- East Stroudsburg, Pa., metropolitan area (38.6 minutes).
- New York-Newark-Jersey City, N.Y.-N.J.-Pa., metropolitan area (35.9 minutes).
- Washington-Arlington-Alexandria, D.C-Va.-Md.-W.V., metropolitan area (34.4 minutes).
- The shortest average one-way travel times are usually associated with smaller metro areas. Among the shortest were:
- Walla Walla, Wash., metropolitan area (15.4 minutes).
- Grand Forks, N.D.-Minn., metropolitan area (15.5 minutes).
- Great Falls, Mont., metropolitan area (15.6 minutes).
The travel times for Walla Walla, Grand Forks and Great Falls metro areas are not statistically different from each other.
- About 7.5 million workers (5.1 percent) commute by bus, subway, commuter rail, light rail or some other form of public transportation on a typical workday. Public transportation usage is highly concentrated within the nation’s large metro areas.
- Among metro areas with high rates of public transportation commuting,
- The New York-Northern New Jersey-Long Island, N.Y.-N.J.-Pa., metropolitan area stands out with 31.0 percent of workers (2,918,906 people) commuting by transit.
- The San Francisco-Oakland-Hayward, Calif., metropolitan area and the Washington-Arlington-Alexandria, D.C.-Va.-Md.-W.V., metropolitan area are at 16.5 percent (369,759 people) and 14.0 percent (443,870 people), respectively.
- County-level commuting data are available here.
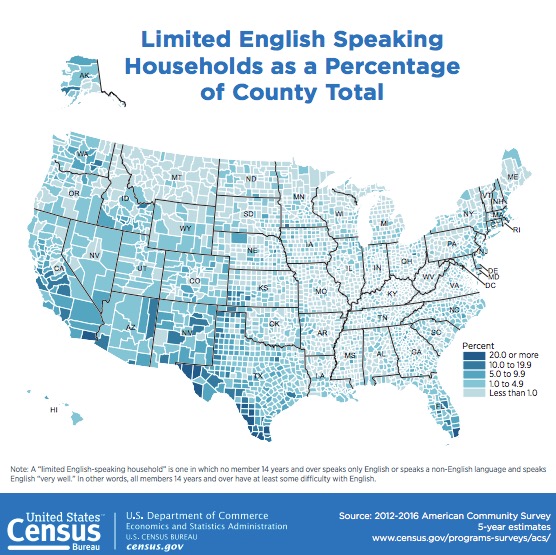
Language Spoken at Home and English-Speaking Ability
Between 2012 and 2016, 21.1 percent (63,172,059) of the population age 5 and older spoke a language other than English at home, an increase from 20.3 percent in the 2007-2011 American Community Survey five-year estimates data.
- Of those who spoke a language other than English at home, 59.7 percent (37,731,103) also spoke English “very well.” This proportion increased from 57.1 percent in 2007-2011.
- New data for five languages are available on American Fact Finder Table B16001: Haitian, Punjabi, Bengali, Telugu and Tamil.
- There were 806,254 people ages 5 and older who spoke Haitian at home. Almost half (48.8 percent) lived in Florida.
- Of the 280,867 people ages 5 and older who spoke Punjabi at home, 48.0 percent lived in California.
- Of the 259,204 people ages 5 and older who spoke Bengali at home, 38.6 percent lived in New York.
- The 321,695 people ages 5 and older who spoke Telugu at home and the 238,699 people speaking Tamil at home were more evenly distributed across many parts of the nation. For both languages, the highest concentration of speakers lived in California, followed by Texas and New Jersey (the number of persons who spoke Tamil in Texas and New Jersey are not statistically different).
Median Gross Rent
The United States experienced a $21 increase in median gross rent — from $928 in 2007-2011 (adjusted for inflation), to $949 in 2012-2016.
- The 50 most populous metropolitan areas had increases in median gross rent that outnumbered decreases four to one. There were 32 increases, eight decreases and nine that had no change from 2007-2011 data. (Comparisons for the Los Angeles-Long Beach-Anaheim, Calif., metropolitan area cannot be made due to boundary changes.)
- Of the 551 micropolitan areas, 146 changed, increases outnumbering decreases two to one with 107 increases and 39 decreases.
- County-level gross rent data are available here.
Income
- Of the 3,142 counties in the United States, 563 counties (17.9 percent) experienced a decline in median household income, while median household income increased in 234 counties (7.4 percent).
- Among the more than 29,000 places in the United States, 3,254 places (11.1 percent) experienced a decline in median household income, while 926 places (3.2 percent) experienced income growth.
- For the period of 2012 to 2016, the locations with the highest and lowest median household incomes were:
- By county and county equivalent:
- Loundon County, Va., Falls Church City, Va., Fairfax County, Va., Howard County, Md., and Arlington County, Va., were among the highest.
- McCreary County, Ky., Sumter County, Ala., Holmes County, Miss., Stewart County, Ga., and Lee County, Ky., were among the lowest.
- By metropolitan statistical area:
- San Jose-Sunnyvale-Santa Clara, Calif., Washington-Arlington-Alexandria, D.C.-Va.-Md.-W.V., California-Lexington Park, Md., Bridgeport-Stamford-Norwalk, Conn., and San Francisco-Oakland-Hayward, Calif., metropolitan statistical areas were among the highest.
- Brownsville-Harlingen, Texas, Sebring, Fla., McAllen-Edinburg-Mission, Texas, Pine Bluff, Ark., and Valdosta, Ga., metropolitan statistical areas were among the lowest.
- By micropolitan statistical area:
- Los Alamos, N.M., Summit Park, Utah, Williston, N.D., Juneau, Alaska, and Gillette, Wyo., micropolitan statistical areas were among the highest.
- Middlesborough, Ky., Rio Grande City, Texas, Helena-West Helena, Ark., Las Vegas, N.M., and Indianola, Miss., micropolitan statistical areas were among the lowest.
Poverty
- Of the 3,142 counties across the nation, 167 counties (5.3 percent) experienced a decline in poverty rates, while 566 counties (18.0 percent) showed a rate increase.
- Looking at the more than 29,000 places in the United States, 1,391 places (4.7 percent) experienced a decline in poverty rates, while 2,927 places (10.0 percent) had their poverty rates increase.
- From 2012 to 2016, among geographic areas with 10,000 people or more:
- By county and county equivalent:
- Falls Church City, Va., and Lincoln County, S.D., had among the lowest poverty rates for counties and county equivalents.
- Oglala Lakota County and Todd County in South Dakota, Holmes County, Miss., and McCreary County, Ky., had among the highest poverty rates.
- By metropolitan statistical area:
- Among all metropolitan areas, Fairbanks, Alaska, California-Lexington Park, Md., Midland, Texas, and Barnstable Town, Mass., had among the lowest poverty rates.
- Brownsville-Harlingen, McAllen-Edinburg-Mission and Laredo, Texas, had among the highest poverty rates.
- By micropolitan areas:
- Los Alamos, N.M., McPherson, Kan., and Dickinson, N.D., were among those with lower poverty rates.
- Gallup, N.M., Cleveland, Miss., and Rio Grande City and Raymondville, Texas, were among those with higher poverty rates.
Also Released from the American Community Survey:
- Examining the Effect of Off-Campus College Students on Poverty Rates
- Gross Rent Continues to Rise
- Uncovering Trends in Income and Poverty Using Model-Based Estimates
- Understanding the Relationship Between Individual Earnings and Household Income
- The five-year estimates feature “Comparison Profile” tables. These tables compare differences between the latest set of American Community Survey five-year estimates (2012-2016) and the most recent, nonoverlapping five-year estimates (2007-2011). The tables note statistically significant differences.
- The Application Programming Interface updated with 2012-2016 American Community Survey five-year estimates statistics.
- Guidance on making comparisons is available on our website.

New Data Exploration Platform with County-Level Geography Profiles
The U.S. Census Bureau is currently working to streamline online data dissemination to be more customer-driven and user-friendly by creating one centralized and standardized platform to underlie the search on census.gov. In addition to being available through the American FactFinder, some of the 2012-2016 American Community Survey five-year estimates will be released through the new platform, which is currently a preview site at data.census.gov. Specific products available include detailed tables, data profiles, subject tables and comparison profiles.
New for this release, data.census.gov is featuring county-level geography profiles, which provide data users a high-level overview of each of the 3,144 counties in a visual format with maps, charts and graphs. These profiles include 2012-2016 American Community Survey five-year estimates data on a variety of topics including income, commuting, home ownership and veterans, as well as business and industry data from the 2012 Economic Census, 2012 County Business Patterns and 2015 Survey of Business Owners.
Filed under: Associations and Organizations, Data Files, Funding, Maps, News, Patrons and Users, Profiles
About Gary Price
Gary Price (gprice@gmail.com) is a librarian, writer, consultant, and frequent conference speaker based in the Washington D.C. metro area. He earned his MLIS degree from Wayne State University in Detroit. Price has won several awards including the SLA Innovations in Technology Award and Alumnus of the Year from the Wayne St. University Library and Information Science Program. From 2006-2009 he was Director of Online Information Services at Ask.com.
ADVERTISEMENT
Archives

ADVERTISEMENT