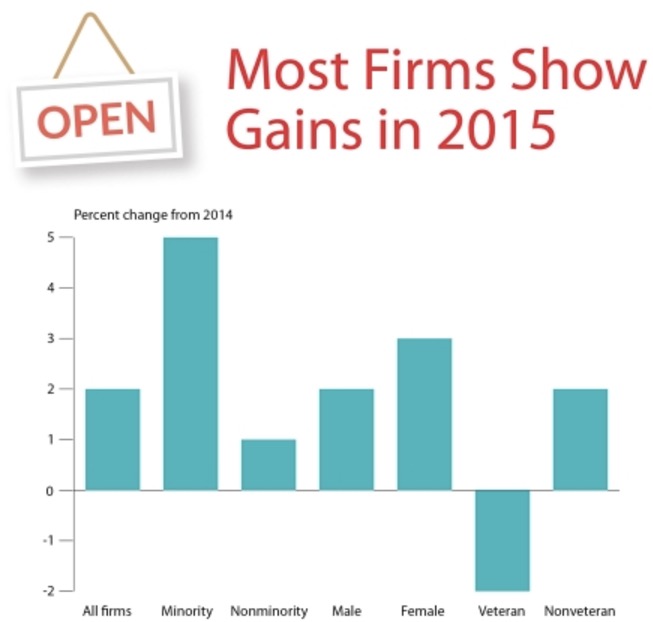
Minority-owned employer firms in the United States increased by approximately 4.9 percent in 2015 to 996,248 from 949,318 in 2014, according to findings from the U.S. Census Bureau’s 2015 Annual Survey of Entrepreneurs.
Payroll and employment for minority-owned employer firms in the nation also increased from 2014 to 2015 by approximately 7.0 percent ($237.5 billion to $254.0 billion) and 6.2 percent (7.6 million to 8.0 million people employed), respectively. Receipts for minority-owned firms in 2015 were estimated at $1,168.5 billion — not statistically different from the 2014 total of $1,089.7 billion.
“California led all states in the number of minority-owned firms with approximately 228,148 (22.9 percent of the U.S. total of minority-owned firms) and the New York-Newark-Jersey City, NY-NJ-PA metropolitan area led the 50 most populous metropolitan statistical areas in the number of minority-owned firms (approximately 127,736 or 12.8 percent”), said Kimberly Moore, chief of the Economy-Wide Statistics Division.
More than one-quarter (14) of the 50 most populous metropolitan statistical areas had approximately 15,000 or more minority-owned employer businesses. About one-third of employer firms (34.6 percent) in the accommodation and food services sector were minority-owned. Source: U.S. Census (2015 Annual Survey of Entrepreneurs) About the Survey
The Annual Survey of Entrepreneurs provides a timely, demographic portrait of the nation’s employer businesses by gender, ethnicity, race and veteran status. The survey represents a public-private partnership between the Census Bureau, the Ewing Marion Kauffman Foundation and the Minority Business Development Agency.
Tables released today provide estimates on the number of firms, receipts, payroll and employment for the nation, states and the District of Columbia, and the 50 most populous metropolitan statistical areas. Firm size data are available by sales (e.g., the number of firms with sales/receipts of $1.0 million or more) and employment (e.g., the number of firms with 500 employees or more).
Ownership of firms by women increased by 3.0 percent from 2014 (to approximately 1.1 million in 2015). Payroll for women-owned firms also increased from $277.9 billion in 2014 to $293.1 billion in 2015 — a change of 5.5 percent. California led all states in the number of women-owned firms with approximately 140,817 (12.9 percent of all women-owned firms in the United States) and the New York-Newark-Jersey City, NY-NJ-PA metropolitan area led the 50 most populous metropolitan statistical areas in the number of women-owned firms (approximately 94,577, or 8.7 percent of all women-owned firms in the United States).
Additionally, about one-quarter (268,629, or 24.7 percent) of all women-owned employer firms were minority-owned. More than half (approximately 146,101 or 54.4 percent) of these minority women-owned firms were Asian-owned. Among all employer firms in the educational services, health care and social assistance, and other services sectors, women-owned firms represented a proportion of approximately 25.0 percent or more. Women-owned firms also accounted for receipts totaling $1,353.3 billion in 2015 — not statistically different from the 2014 receipts ($1,321.2 billion) for women-owned firms.
Meanwhile, veteran-owned employer firms decreased by 1.7 percent in 2015 (398,453) down from 405,235 in 2014. The New York-Newark-Jersey City, NY-NJ-PA metropolitan area led the 50 most populous metropolitan statistical areas in the number of veteran-owned firms (approximately 20,199 or 5.1 percent of all veteran-owned firms in the United States) — not statistically different than 2014. Other highlights include:
Hawaii and California led all states in the percentage of all employer businesses that were minority-owned, at 55.9 percent and 32.6 percent, respectively. The remaining states (or equivalents) in which approximately 20.0 percent or more of employer businesses were minority-owned were Texas (27.0 percent), the District of Columbia (26.3 percent), Florida (24.3 percent), New Mexico (23.4 percent), New Jersey (23.1 percent), Maryland (22.8 percent), New York (22.5 percent), Virginia (21.4 percent), Georgia (20.4 percent) and Nevada (18.7 percent).
Of the 996,248 minority-owned firms with paid employees, more than half (530,406, or 53.2 percent) were Asian-owned.
About 14.3 percent of black- or African-American-owned employer businesses had been in business for less than two years, compared with 8.9 percent of all employer firms.
The nation’s firms employed an estimated 118.4 million people and generated $33.6 trillion in receipts. Annual payroll totaled $5.9 trillion.
Among all employer firms, approximately 33.0 percent (1,824,735) were in business 16 or more years with approximately 8.9 percent (492,912) in business less than two years.
About 1.5 million employer firms, or 26.5 percent, had receipts of $1.0 million or more. In contrast, 98,484 or 1.8 percent, had receipts of less than $10,000.
Sectors with the highest number of employer firms were professional, scientific and technical services (787,376); construction (652,561); retail trade (649,870); and health care and social assistance (640,655).
Among all minority-owned employer firms, the accommodation and food services sector was the largest at 175,682 (17.6 percent) firms.
Most firms had fewer than 10 employees (4.3 million, or 78.2 percent).
Each year’s release of the Annual Survey of Entrepreneurs contain a module focusing on a different topic.
This year’s survey highlights management practices.
Respondents were asked a series of questions about worker types and types of tasks performed by each worker type included in the 2015 Annual Survey of Entrepreneurs’ worksheet.
Module data also provide estimates on the following tasks by type of worker:
Procurement, logistics, and distribution.
Operations.
Marketing, sales and customer accounts.
Customer and after sales service.
Product or service development.
Technology and process development.
General management and firm infrastructure.
Human resources management.
Strategic management.
The statistics released through the Annual Survey of Entrepreneurs are not directly comparable to the Survey of Business Owners, which collects more detailed data on business characteristics and has significant differences in methodologies. Note: Firms in this news release refer only to employer firms. The Annual Survey of Entrepreneurs does not distinguish between U.S. residents and nonresidents. Companies owned by other companies, foreign or domestic that have U.S. operations, are included in the category “Publicly held and other firms not classifiable by gender, ethnicity, race and veteran status.” The Annual Survey of Entrepreneurs collected data from a sample of approximately 290,000 employer businesses that were in operation anytime during the survey year. The collected data in a sample survey are subject to sampling variability, as well as nonsampling errors. Sources of nonsampling errors include errors in response, nonreporting and coverage.
2015 Annual Survey of Entrepreneurs Data Resources
Gary Price (gprice@gmail.com) is a librarian, writer, consultant, and frequent conference speaker based in the Washington D.C. metro area.
He earned his MLIS degree from Wayne State University in Detroit.
Price has won several awards including the SLA Innovations in Technology Award and Alumnus of the Year from the Wayne St. University Library and Information Science Program. From 2006-2009 he was Director of Online Information Services at Ask.com.