Reference: AMS/NOAA Release 2015 “State of the Climate” Report (Including Interactive Map)
From Climate.gov/NOAA:
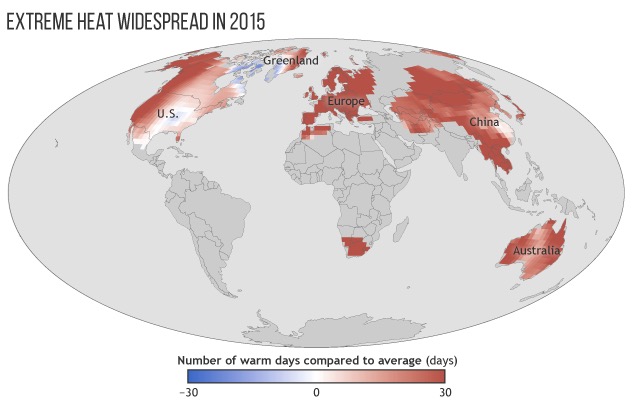
People, plants, and animals don’t experience the global average temperature, which we hear so much about in relation to global warming. We experience temperatures locally, through daily temperature extremes. So the number of extremely warm days in a year can be a more meaningful indicator for how people, agriculture, and natural ecosystems feel the effects of climate change. In 2015, the frequencies of extremely warm days and nights were the highest ever recorded in western North America, parts of central Europe, and central Asia.
Adapted from the BAMS State of the Climate in 2015 report, the map [below] shows the frequency of warm days in 2015 compared to the long-term (1961-1990) average. For this analysis, days with temperatures warmer than 90 percent of the 1961-1990 seasonal record are considered “extremely warm days.” The areas shaded red had a higher-than-average number of extremely warm days in 2015.
[Clip]
In 2015, several regions, including western North America, Europe, and large parts of Asia and Australia experienced strong warm anomalies throughout much of the year. There were a number of notable extreme temperature events, including the European summer heat waves, a number of Asian heatwaves (in India, Pakistan, and Indonesia), and a warm spring and fall in Australia, Alaska, and western Russia.
Extremely warm days can pose human health risks, especially in places that lack air conditioning; can stunt crops or interrupt key growth stages; and can stress livestock and other animals, including commercially and recreationally valuable fish in rivers and streams. The National Integrated Heat Health Information System names extreme heat events as one of the leading weather-related causes of death in the United States. According to the National Climate Assessment, from 1999 through 2009, extreme heat exposure caused more than 7,800 deaths.
[Clip]
The State of the Climate report series is the authoritative annual summary of the global climate. Published in the Bulletin of the American Meteorological Society, the report is edited by scientists at NOAA’s National Centers for Environmental Information. The 2015 report is based on contributions from more than 450 scientists from 62 countries, drawing on tens of thousands of measurements of Earth’s climate.
Resources
Summary/News Release
Highlights
Interactive Map
Briefing Slides
All Resources
Direct to Full Text Report (300 pages; PDF)
About Gary Price
Gary Price (gprice@gmail.com) is a librarian, writer, consultant, and frequent conference speaker based in the Washington D.C. metro area. He earned his MLIS degree from Wayne State University in Detroit. Price has won several awards including the SLA Innovations in Technology Award and Alumnus of the Year from the Wayne St. University Library and Information Science Program. From 2006-2009 he was Director of Online Information Services at Ask.com.
ADVERTISEMENT
Archives

ADVERTISEMENT