New “State of the Climate” Report/Data: “2015 is Earth’s Warmest Year by Widest Margin on Record”
New report and data from NOAA’s National Climatic Data Center.
From the December “State of the Climate Report/Summary, Global)
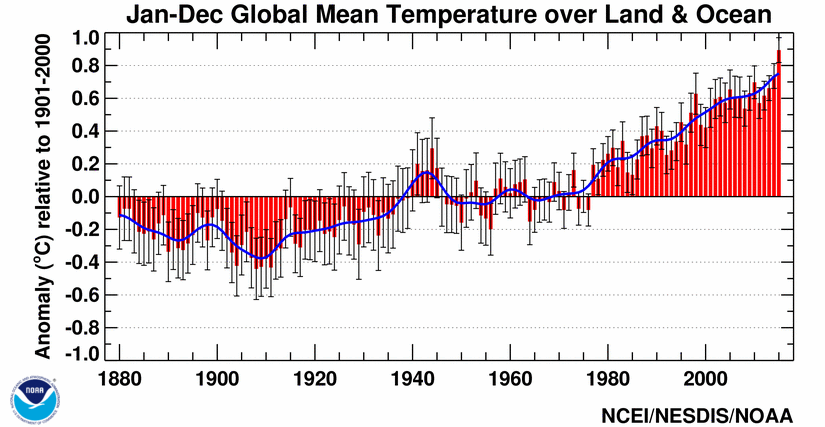
The globally averaged temperature over land and ocean surfaces for 2015 was the highest among all years since record keeping began in 1880. During the final month, the December combined global land and ocean average surface temperature was the highest on record for any month in the 136-year record.
During 2015, the average temperature across global land and ocean surfaces was 1.62°F (0.90°C) above the 20th century average. This was the highest among all 136 years in the 1880–2015 record, surpassing the previous record set last year by 0.29°F (0.16°C) and marking the fourth time a global temperature record has been set this century. This is also the largest margin by which the annual global temperature record has been broken. Ten months had record high temperatures for their respective months during the year. The five highest monthly departures from average for any month on record all occurred during 2015.
During 2015, the globally-averaged land surface temperature was 2.39°F (1.33°C) above the 20th century average. This was the highest among all years in the 1880–2015 record, surpassing the previous record of 2007 by 0.45°F (0.25°C). This is the largest margin by which the annual global land temperature has been broken.
During 2015, the globally-averaged sea surface temperature was 1.33°F (0.74°C) above the 20th century average. This was the highest among all years in the 1880–2015 record, surpassing the previous record of last year by 0.20°F (0.11°C).
Read the Complete Summary Report/Graphics
Direct to Full Global Report/Graphics/Access Data
Read the Complete Summary Report/Graphics/Data
Direct to Full Global Report/Graphics/Data
UPDATE: 2015 Was The Warmest Year Ever Recorded On Earth (via NASA)
Animation
This animation shows a time-series of the Merged Land and Ocean Surface Temperature dataset that is analyzed and curated by NOAA’s National Centers for Environmental Information, and also available in NOAA View. Blue colors indicate temperatures cooler than then 20th Century average; red colors are warmer than the 20th Century average. Although temperatures vary from year to year and place to place, a consistent trend arises over time where global average temperature increases.
Filed under: Data Files, News
About Gary Price
Gary Price (gprice@gmail.com) is a librarian, writer, consultant, and frequent conference speaker based in the Washington D.C. metro area. He earned his MLIS degree from Wayne State University in Detroit. Price has won several awards including the SLA Innovations in Technology Award and Alumnus of the Year from the Wayne St. University Library and Information Science Program. From 2006-2009 he was Director of Online Information Services at Ask.com.
ADVERTISEMENT
Archives

ADVERTISEMENT