New Population Estimates From U.S. Census: “Over Two-Thirds of the Nation’s Counties Had Natural Decrease in 2021”
Note: Downloadable tables and datasets (.xls) for today’s release are available here.
From the U.S. Census:
More than 73% (2,297) of U.S. counties experienced natural decrease in 2021, up from 45.5% in 2019 and 55.5% in 2020, according to the U.S. Census Bureau’s Vintage 2021 estimates of population and components of change released today. Natural decrease occurs when there are more deaths than births in a population over a given time period. In 2021, fewer births, an aging population and increased mortality – intensified by the COVID-19 pandemic–contributed to a rise in natural decrease. The statistics released today include population estimates and components of change for the nation’s 384 metropolitan statistical areas, 543 micropolitan statistical areas and 3,143 counties.
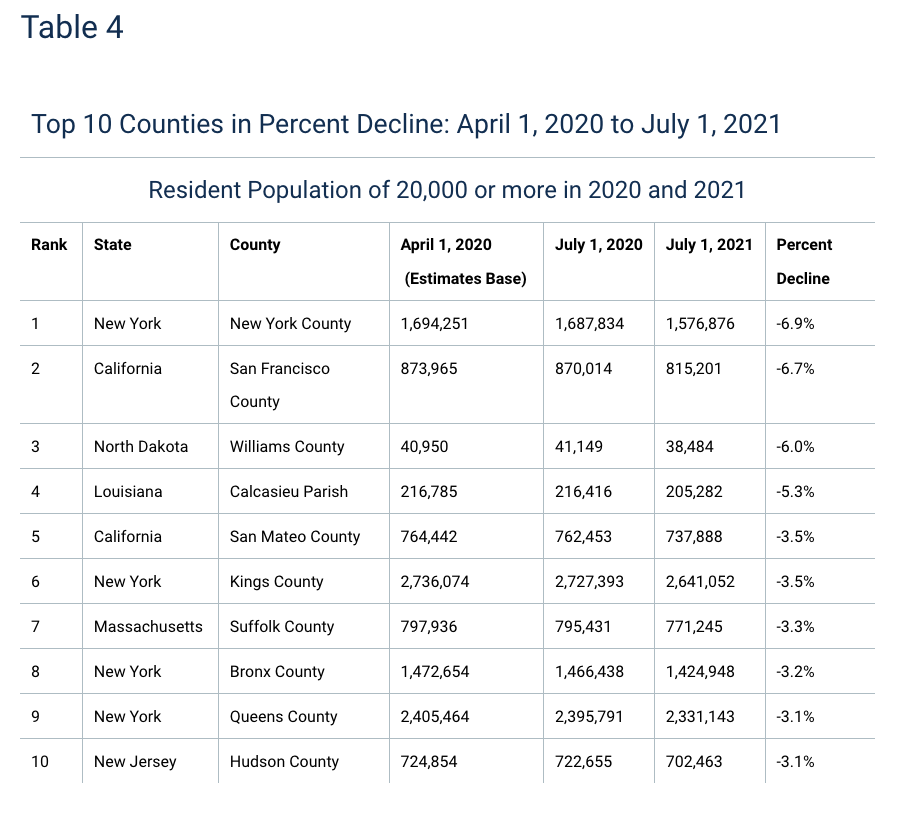
In 2021, all counties in Delaware, Maine, New Hampshire and Rhode Island experienced natural decrease. Some counties also experienced population declines attributable to migration. Counties with net international migration loss (more people moving out of than into the country), were most frequently found in California (41.4%), Oregon (27.8%) and Mississippi (23.2%). States with the highest percentages of counties with net domestic migration loss (people moving from one area to another within the United States) were Alaska (80.0%), Louisiana (71.9%) and Illinois (65.7%).
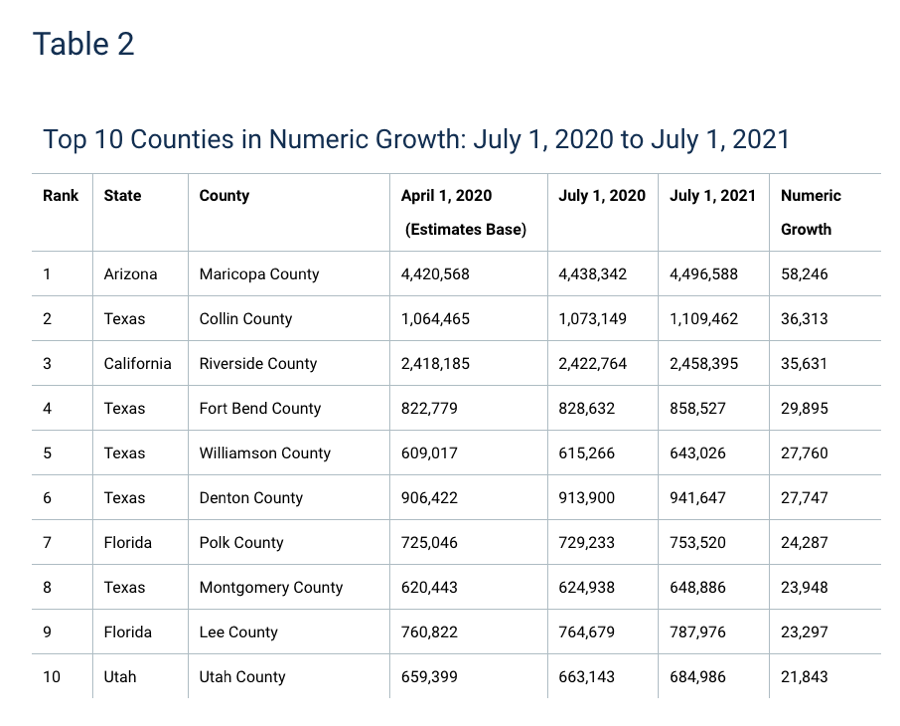
Most of the nation’s counties – 2,063 or 65.6% — experienced positive domestic migration overall from 2020 to 2021. Arizona’s Maricopa County gained the most (46,866) residents from domestic migration, followed by Riverside County, California (31,251), and Collin County, Texas (30,191). Los Angeles County, California, experienced the greatest net domestic migration loss (179,757 residents), followed by New York County, New York (113,642).
“The patterns we’ve observed in domestic migration shifted in 2021,” said Dr. Christine Hartley, assistant division chief for estimates and projections in the Census Bureau’s Population Division. “Even though over time we’ve seen a higher number of counties with natural decrease and net international migration continuing to decline, in the past year, the contribution of domestic migration counteracted these trends so there were actually more counties growing than losing population.”
In many cases, there was a shift from larger, more populous counties to medium and smaller ones. These patterns contributed to population increases in 1,822 counties (58.0%), while 1,313 (41.8%) lost residents, and eight (0.3%) saw no change in population.U.S. micro areas, up 0.2% between 2020 and 2021, grew slightly faster than U.S. metro areas, which increased by 0.1%. This is a departure from past trends when metro areas typically grew at a faster rate than micro areas. Among metro areas, 251 (65%) experienced population increases between 2020 and 2021. Of the 543 U.S. micro areas, 287 (52.9%) had population increases in 2021.
Of the 384 metro areas in the 50 states and District of Columbia, 213 (55.5%) experienced natural decrease in 2021, with Pittsburgh, PA (-10,838); Tampa-St. Petersburg-Clearwater, FL (-9,291); and North Port-Sarasota-Bradenton, FL (-6,643) having the highest levels. Sixty-three percent of metro areas had positive net domestic migration, with Phoenix-Mesa-Chandler, AZ (66,850); Dallas-Fort Worth-Arlington, TX (54,319); and Tampa-St. Petersburg-Clearwater, FL (42,089) seeing the largest net domestic migration gains. The largest metropolitan net domestic migration losses were in New York-Newark-Jersey City, NY-NJ-PA (385,455); Los Angeles-Long Beach-Anaheim, CA (204,776); San Francisco-Oakland-Berkeley, CA (128,870); and Chicago-Naperville-Elgin, IL-IN-WI (106,897).
Additional Highlights

Counties
- Growth and decline:
- Five of the top 10 largest-gaining counties in 2021, were in Texas. Collin, Fort Bend, Williamson, Denton and Montgomery counties gained a combined 145,663 residents.
- Los Angeles County, California experienced the largest population loss of any county, losing 159,621 residents in 2021.
- Seventy-one percent of counties (2,218) experienced positive net international migration.
- Four counties crossed the threshold of 100,000 residents in 2021—Cleveland County, North Carolina (100,359), Lancaster County, South Carolina (100,336), Bastrop County, Texas (102,058), and Grant County, Washington (100,297).
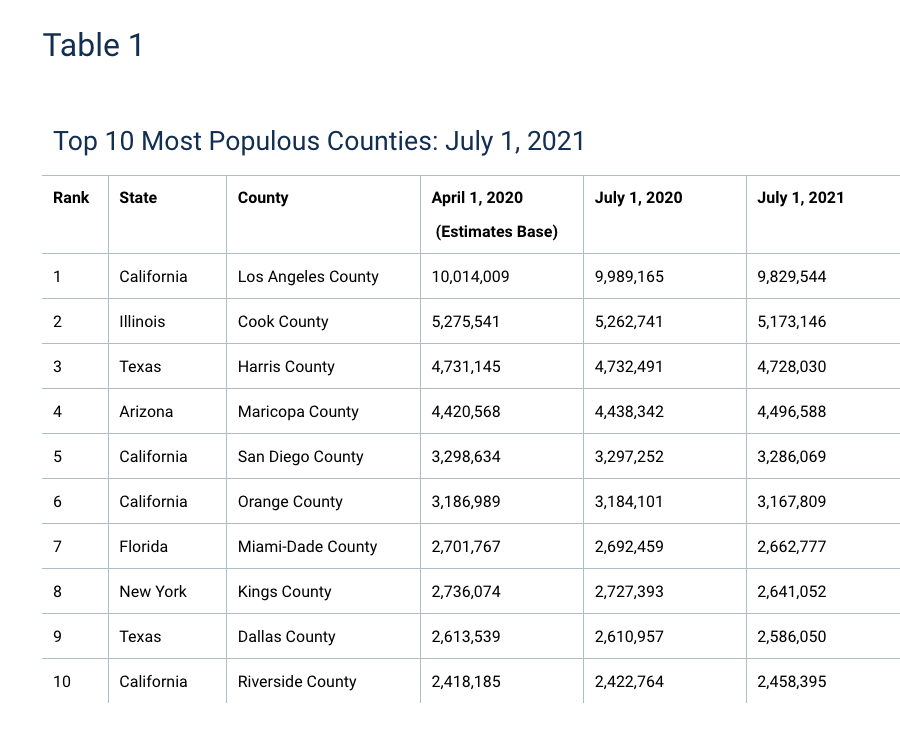
- Los Angeles County, California (9,829,544) and Cook County, Illinois (5,173,146), had more than 5 million residents in 2021, making them the top two most populous counties in the nation.
Municipios (Puerto Rico)
- In 2021, all 78 municipios experienced natural decrease. San Juan had the highest natural decrease at -1,704, followed by Bayamón (-920) and Carolina (-834).
- Thirty-five (44.9%) municipios had positive net migration in 2021, with Gurabo (733) and Toa Alta (704) seeing the largest population gains.
- In 2021, 15 municipios gained residents, 62 lost residents, and one had no change in population.
Metropolitan Statistical Areas
- Growth:
- Sixty-five percent (251 of 384) of the metro areas within the 50 states and the District of Columbia experienced population increase between 2020 and 2021.
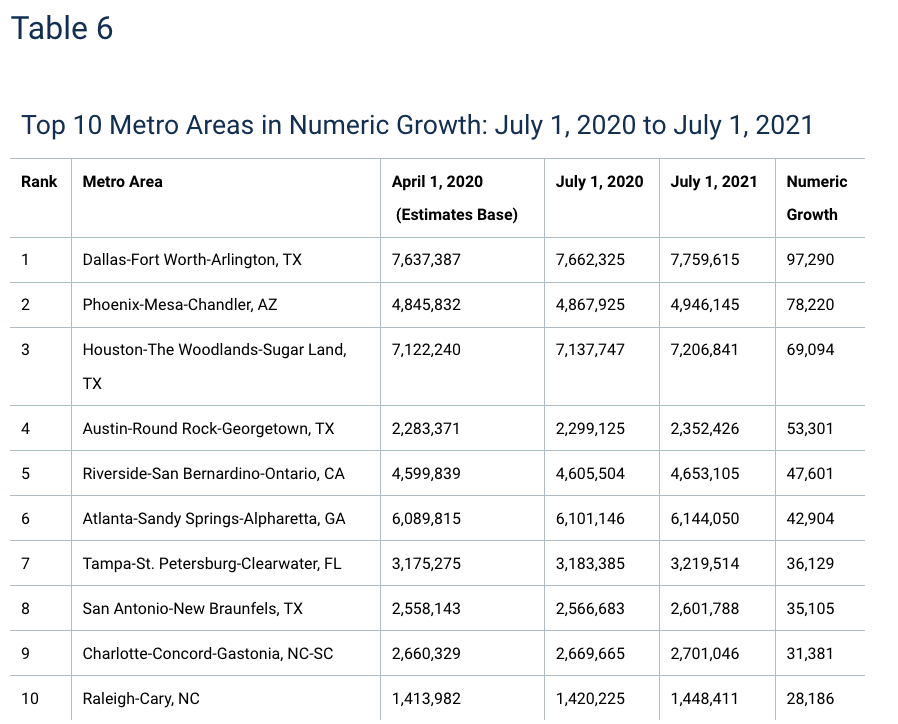
- Texas was home to four of the top 10 largest-gaining metro areas.
- Sixty-three percent of metro areas had positive net domestic migration. Seeing the largest net domestic migration gains were Phoenix-Mesa-Chandler, AZ (66,850), Dallas-Fort Worth-Arlington, TX (54,319), and Tampa-St. Petersburg-Clearwater, FL (42,089).
- Net international migration was positive in 353 (91.9%) of metros.
- Having gained 17,133 residents between 2020 and 2021, Nashville-Davidson–Murfreesboro–Franklin, TN, crossed the threshold of 2 million residents, for a total population of 2,012,476.
- Decline:
- Metro areas with notable numeric population declines between 2020 and 2021 were San Francisco-Oakland-Berkeley, CA (-116,385) and Chicago-Naperville-Elgin, IL-IN-WI (-91,671).
- Lake Charles, LA (-5.3%), Odessa, TX (-2.6%) and San Francisco-Oakland-Berkeley, CA (-2.5%) had the largest percent decreases in population.
Micropolitan Statistical Areas
- Of the 543 micro areas within the 50 states and District of Columbia, 52.9% (287) had a population increase between 2020 and 2021.
- Williston, ND had the largest numeric (-2,665) and percent (-6.5) decrease in population.
- Shelby, NC and Moses Lake, WA both crossed the 100,000 residents threshold between 2020 and 2021, reaching 100,359 and 100,297, respectively.
The Population Estimates Program uses current data on births, deaths and migration to calculate population change since the most recent decennial census and produce a time series of estimates of population, demographic components of change and housing units. The annual time series of estimates begins with the most recent decennial census date and extends to the vintage year. This is the second release of population estimates data developed from a base population that integrates the 2020 Census, Vintage 2020 estimates, and 2020 Demographic Analysis estimates. Comparisons to previous years are not recommended.
With each new release of annual estimates, the entire time series of estimates is revised for all years back to the last census. All previously published estimates (i.e., old vintages) are superseded and archived on the <https://www2.census.gov/programs-surveys/popest/datasets/>.
More information on the timing of specific population and housing unit estimates products is available at <https://www.census.gov/programs-surveys/popest/about/schedule.html>. The Vintage 2020 methodology statement and release notes are available at <https://www.census.gov/programs-surveys/popest/technical-documentation/methodology.html

Filed under: Data Files, Funding, News
About Gary Price
Gary Price (gprice@gmail.com) is a librarian, writer, consultant, and frequent conference speaker based in the Washington D.C. metro area. He earned his MLIS degree from Wayne State University in Detroit. Price has won several awards including the SLA Innovations in Technology Award and Alumnus of the Year from the Wayne St. University Library and Information Science Program. From 2006-2009 he was Director of Online Information Services at Ask.com.
ADVERTISEMENT
Archives

ADVERTISEMENT