New Interactive Graphic: “How Many Voted in Your Congressional District in 2018?”
From the U.S. Census:
Demographic characteristics of eligible voters in a congressional district can provide information and insight into voter turnout in elections.
Voter turnout in the 2018 congressional election was lower in districts with larger proportions of voting-age citizens without a high school diploma
Turnout is consistently lower for congressional elections than for national presidential campaigns, according to the Current Population Survey.
For example, in the 2018 congressional election about a quarter of registered voters reported they were too busy to vote. Yet, in any election demographic characteristics, such as education level, income and age, are all factors that may affect turnout at the polls.
The interactive graphic below uses Census Bureau population characteristics data from the American Community Survey and counts of votes cast from the Office of the Clerk U.S. House of Representatives.
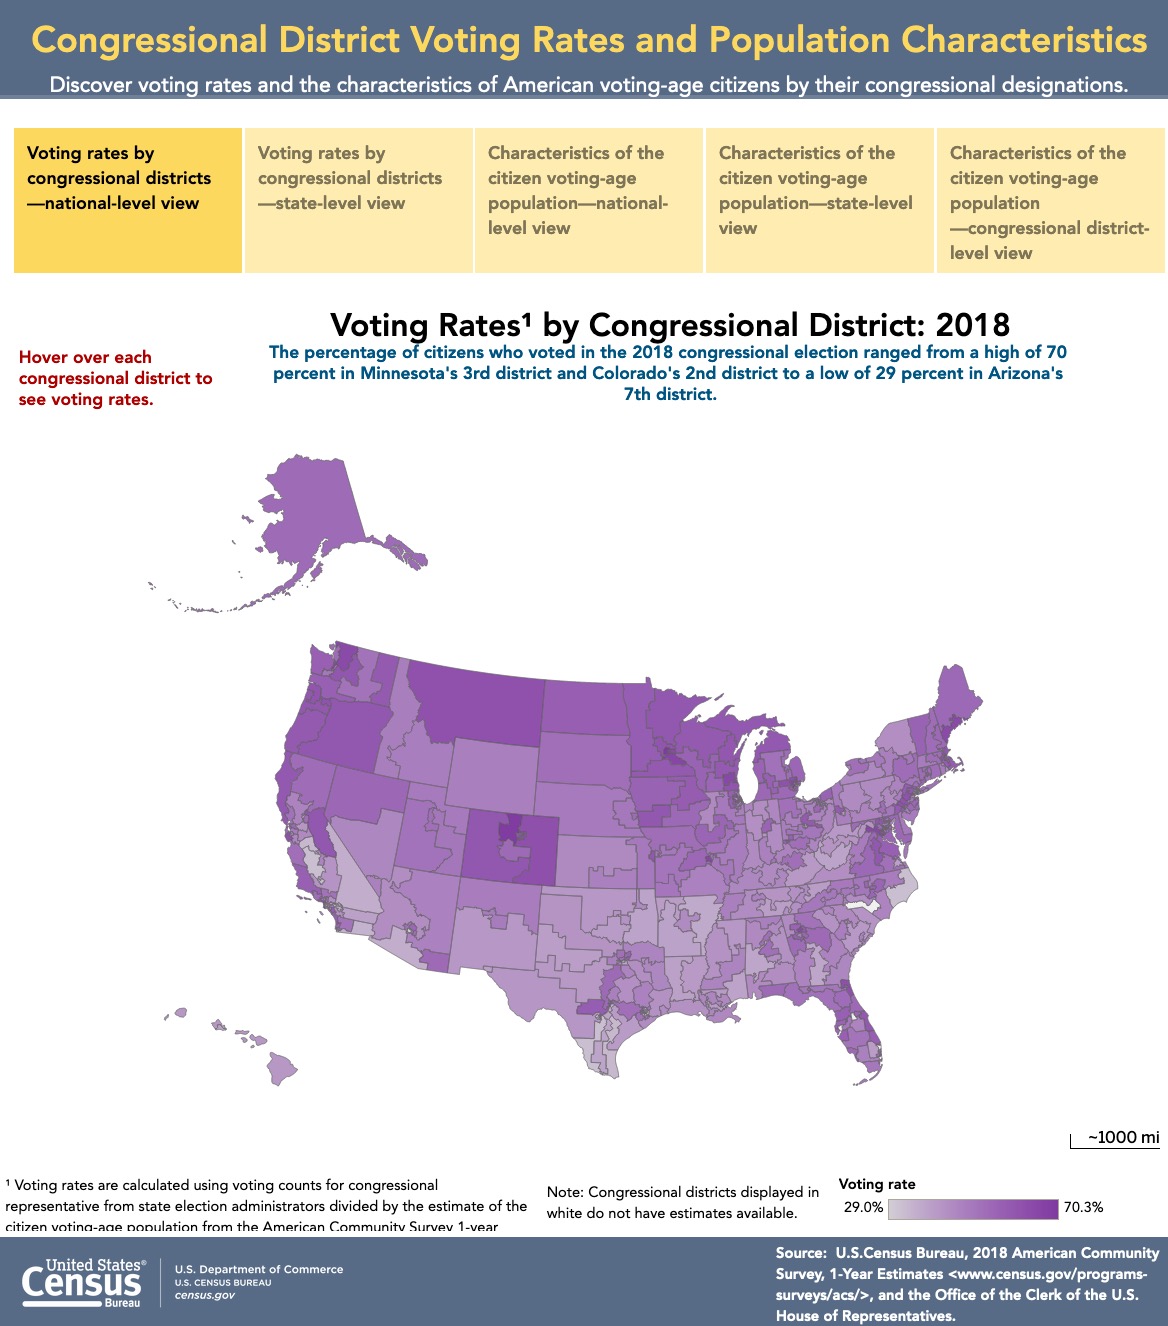
The combined data highlight variations across the nation in both the percent of citizens who voted for congressional representatives in 2018 and the characteristics of the citizen voting-age population for each congressional district.
The interactive graphic shows:
- Two views of voting rates for congressional districts – a national-level perspective and a closer look at each state.
- Three views of the characteristics of the citizen voting-age population at the national level, at the state level and at the congressional district level.
Direct to Interactive Graphic
Minnesota’s 3rd Congressional District and Colorado’s 2nd Congressional District led the country with the highest percentage (about 70%) of citizens voting for a representative in 2018. Arizona’s 7th District had the lowest rate (29.0%).
California had one of the widest ranges in voting rates across its 53 congressional districts, from 61.5% in the 18th District to 32.0% in the 21st District, a difference of nearly 30 percentage points.
Seven states, plus the District of Columbia, have only one congressional district each.
Demographic Characteristics of the Citizen Voting-age Population of Congressional Districts
Education
- New York’s 12th District has the highest percentage (71.0%) of voting-age citizens with a bachelor’s degree or more.
- In contrast, a quarter of eligible voters in New York’s 15th, California’s 40th and Texas’ 29th districts lack a high school diploma.
- In most instances, districts where a large proportion of voting-age citizens lacked a high school diploma had the lowest voter turnout in 2018.
Men and Women
Most districts, about 4 in 5, have more citizen voting-age women than men, according to the American Community Survey.
New York’s 8th District has the highest percentage (56.5%) of citizen voting-age women in the country. In contrast, California’s 21st and 51st districts and Alaska’s at-large district have among the lowest percentages (about 47%) of women. In general, women are more likely than men to register and vote.
Race and Hispanic Origin
- In Hawaii’s 1st District, about half of the voting-age citizens are Asian, the highest percentage in the country.
- Hawaii’s 2nd District has 12.1% Native Hawaiian and other Pacific Islanders – the highest percentage in the country.
- Hispanics made up more than half of voting-age citizens in 24 congressional districts: Arizona (3rd), California (21st, 29th, 32nd, 35th, 38th, 40th, 41st, 44th, 46th and 51st), Florida (25th, 26th and 27th), Illinois (4th), New York (15th) and Texas (15th, 16th, 20th, 23rd, 28th, 29th, 34th, and 35th).
Across these heavily Hispanic districts, voting rates in 2018 ranged from 54.4% to 31.3%.
Direct to Interactive Graphic
Direct to Complete Post, Learn About Data
Filed under: Data Files, News
About Gary Price
Gary Price (gprice@gmail.com) is a librarian, writer, consultant, and frequent conference speaker based in the Washington D.C. metro area. He earned his MLIS degree from Wayne State University in Detroit. Price has won several awards including the SLA Innovations in Technology Award and Alumnus of the Year from the Wayne St. University Library and Information Science Program. From 2006-2009 he was Director of Online Information Services at Ask.com.
ADVERTISEMENT
Archives

ADVERTISEMENT