Reference: A New Way to Track the Canadian Job Market
From Statistics Canada:
Statistics Canada’s monthly figures on employment, unemployment and the labour force participation rate—three essential Labour Market Indicators (LMIs)—are among its most sought-after data.
The media, labour market analysts, economists, consultants, planners, forecasters and academics in both the private and public sectors look forward to seeing the latest numbers on the first Friday of each month.
Private‑sector organizations use these figures to track trends in the economy, while different levels of government use them to evaluate and plan employment programs in Canada.
Many users access labour data using the LMI Desktop Application. And this month, they will notice an improvement.
What’s new?
The old LMI Desktop Application has been replaced by a new web-based dashboard that makes it easier than ever to track the ups and downs of the job market in communities across the country.
So what exactly has changed?
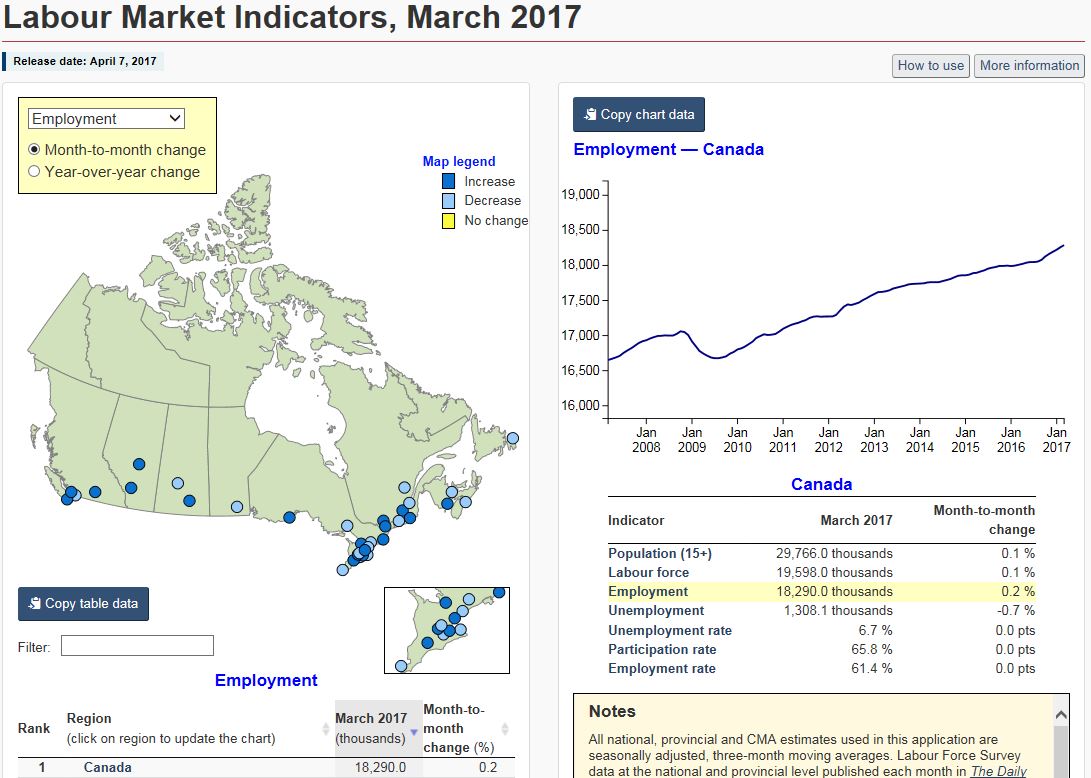
The new dashboard features an updated, user-friendly interface that is both interactive and customizable. Users can view key LMIs on a map and a chart showing labour force characteristics at the national, provincial or census metropolitan area level.
Visually, the new application offers a broader picture of these indicators. Instead of navigating back and forth, users can simultaneously view the map, the chart, the tables and the key indicators within one screen, and click a specific geographic location to update all LMIs. In addition, the data are right there in the application, meaning that users no longer have to extract data from CANSIM and chart those data themselves.
Learn More, Read the Complete Blog Post
Direct to Labour Market Indicators Website
Filed under: Associations and Organizations, Dashboards, Data Files, News, Patrons and Users
About Gary Price
Gary Price (gprice@gmail.com) is a librarian, writer, consultant, and frequent conference speaker based in the Washington D.C. metro area. He earned his MLIS degree from Wayne State University in Detroit. Price has won several awards including the SLA Innovations in Technology Award and Alumnus of the Year from the Wayne St. University Library and Information Science Program. From 2006-2009 he was Director of Online Information Services at Ask.com.
ADVERTISEMENT
Archives

ADVERTISEMENT