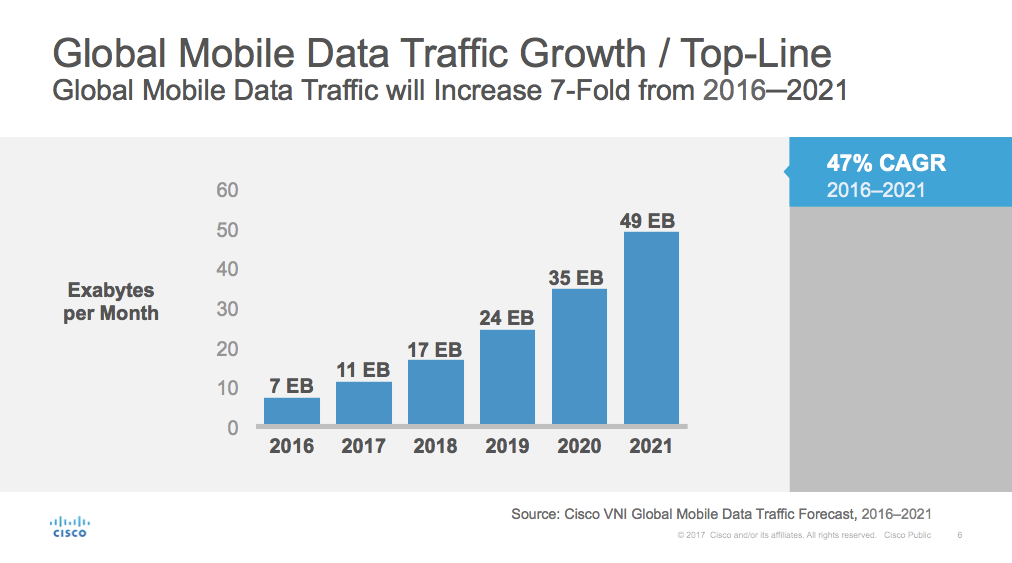
11th Annual Cisco Mobile Visual Networking Index (VNI) Forecast Projects 7-Fold Increase in Global Mobile Data Traffic from 2016-2021
Cisco provides access to a number of Mobile Visual Networking Index (VNI) resources.
Forecast Highlights via Cisco Media Release:
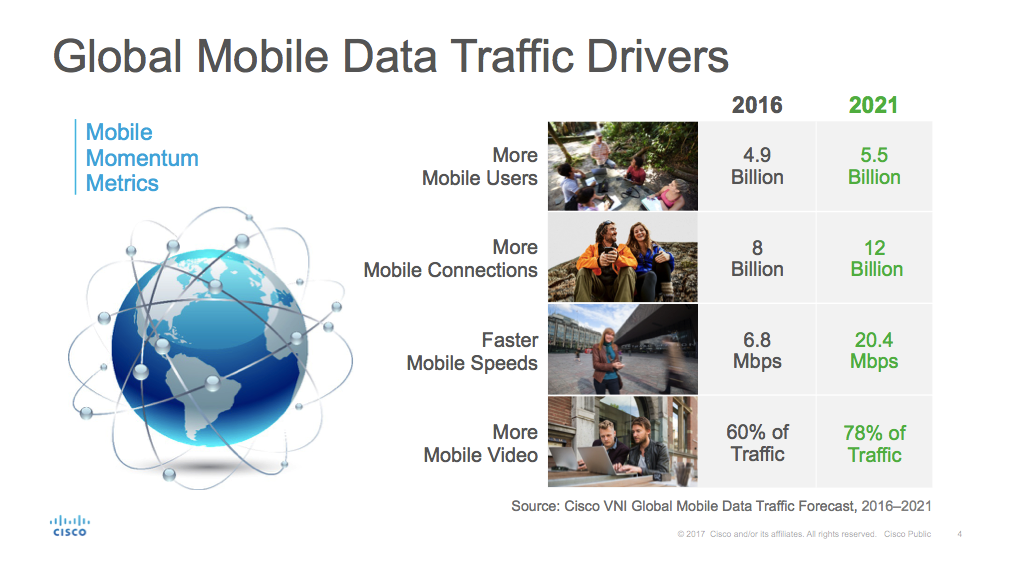
By 2021, more members of the global population[1] will be using mobile phones (5.5 billion) than bank accounts (5.4 billion), running water (5.3 billion), or landlines (2.9 billion), according to the 11th annual Cisco Visual Networking Index™ (VNI) Global Mobile Data Traffic Forecast (2016 to 2021). Strong growth in mobile users, smartphones and Internet of Things (IoT) connections as well as network speed improvements and mobile video consumption are projected to increase mobile data traffic seven-fold over the next five years.
By 2021, Cisco projects mobile data traffic to reach the following milestones:
- Mobile data traffic to represent 20 percent of total IP traffic—up from just 8 percent of total IP traffic in 2016.
1.5 mobile devices per capita. Nearly 12 billion mobile-connected devices (up from 8 billion and 1.1 per capita in 2016), including M2M modules.
- Mobile network connection speeds will increase threefold from 6.8 Mbps in 2016 to 20.4 Mbps by 2021.
- Machine-to-machine (M2M) connections will represent 29 percent (3.3 billion) of total mobile connections—up from 5 percent (780 million) in 2016. M2M will be the fastest growing mobile connection type as global Internet of Things (IoT) applications continue to gain traction in consumer and business environments.
- 4G will support 58 percent of total mobile connections by 2021—up from 26 percent in 2016 and will account for 79 percent of total mobile data traffic
- The total number of smartphones (including phablets) will be over 50 percent of global devices and connections (6.2 billion)—up from 3.6 billion in 2016.
Additional Key Mobile Data Traffic Projections and Forecasted Trends:
1. By 2021, global mobile data traffic will reach 49 exabytes per month or 587 exabytes annually).
- The forecast annual run rate of 587 exabytes of mobile data traffic for 2021 is equivalent to:
- 122 times more than all global mobile traffic generated just 10 years ago in 2011
- 131 trillion images (e.g., MMS)
2. High growth for live video on mobile
- Mobile video will increase 8.7-fold from 2016 to 2021 and will have the highest growth rate of any mobile application category. Mobile video will represent 78 percent of all mobile traffic by 2021.
- Live mobile video will grow 39-fold from 2016 to 2021. Live mobile video will represent 5 percent of total mobile video traffic by 2021.
3. Growth in Virtual Reality (VR) and Augmented Reality (AR)
- VR immerses users in a simulated environment. AR is an overlay of technology on the real world.
- Applications such as virtual reality (VR) are adding to the adoption of wearables such as headsets. VR headsets are going to grow from 18 million in 2016 to nearly 100 million by 2021— a fivefold growth.
- Globally, VR traffic will grow 11-fold from 13.3 petabytes/month in 2016, to 140 petabytes/ month in 2021.
- Globally, AR traffic will grow 7-fold between 2016 and 2021, from 3 petabytes/month in 2016 to 21 petabytes /month in 2021.
4.Global connected wearable devices driving M2M growth
- Cisco estimates there will be 929 million wearable devices globally, growing nearly threefold from 325 million in 2016.
- Globally, the number of wearable devices with embedded cellular connections will reach 69 million in number by 2021—up from 11 million in 2016.
5. Mobile data traffic offload to Wi-Fi networks
- In 2016, 60 percent of total mobile data traffic was offloaded; by 2021, 63 percent of total mobile data traffic will be offloaded.
- In 2016, monthly offload traffic (10.7 EB) exceeded monthly mobile/cellular traffic (7.2 EB).
- Globally, total public Wi-Fi hotspots (including homespots) will grow six-fold from 2016 (94.0 million) to 2021 (541.6 million).
- Wi-Fi traffic from both mobile devices and Wi-Fi-only devices together will account for almost half (49 percent) of total IP traffic by 2020, up from 42 percent in 2015.
6.Regional mobile data traffic growth (2016 – 2021)
The Middle East and Africa will have 12-fold growth
(2016: 7.3 exabytes/year; 2021: 88.4 exabytes/year)
Asia-Pacific will have 7-fold growth
(2016: 37.3 exabytes/year; 2021: 274.2 exabytes/year)
Latin America will have 6-fold growth
(2016: 5.4 exabytes/year; 2021: 34.8 exabytes/year)
Central and Eastern Europe will have 6-fold growth
(2016: 11.1 exabytes/year; 2021: 63.0 exabytes/year)
Western Europe will have 6-fold growth
(2016: 8.8 exabytes/year; 2021: 50.3 exabytes/year)
North America will have 5-fold growth
(2016: 16.9 exabytes/year; 2021: 76.8 exabytes/year)
Selected Report Resources
Report Homepage
White Paper (Numerous Charts) ||| PDF Version (35 pages; PDF)
Filed under: Data Files, Journal Articles, News, Patrons and Users
About Gary Price
Gary Price (gprice@gmail.com) is a librarian, writer, consultant, and frequent conference speaker based in the Washington D.C. metro area. He earned his MLIS degree from Wayne State University in Detroit. Price has won several awards including the SLA Innovations in Technology Award and Alumnus of the Year from the Wayne St. University Library and Information Science Program. From 2006-2009 he was Director of Online Information Services at Ask.com.
ADVERTISEMENT
Archives

ADVERTISEMENT